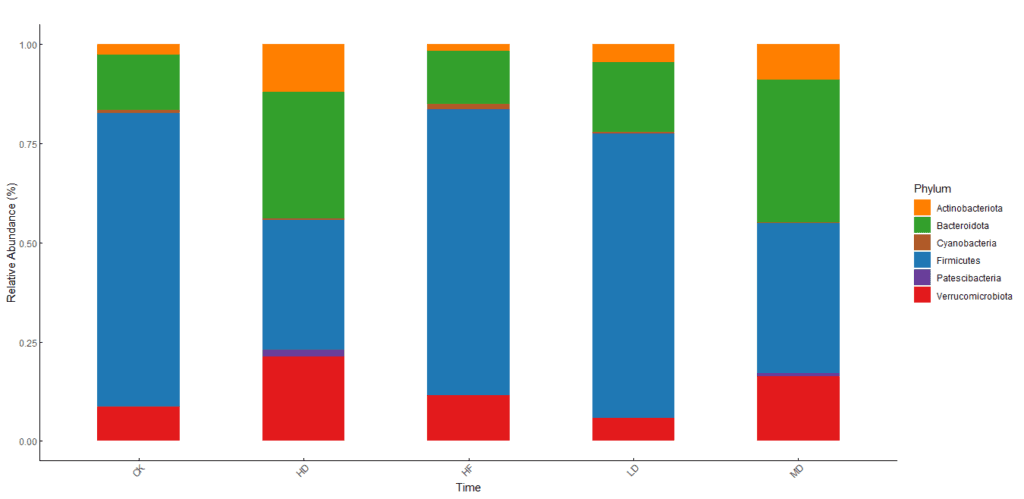
Create a simple relative abundance bar plot in R with your simple data, like below;
| phylum | Firmicutes | Bacteroidota | Verrucomicrobiota | Actinobacteria | Patescibacteria | Cyanobacteria |
| CK | 0.554451243 | 0.182206958 | 0.043143373 | 0.007392163 | 0.003113335 | 0.015268673 |
Table of Contents
STEP 1: Package installation
You need to install below packages;
install.packages(ggplot2)
install.packages(tidyr)
install.packages(dplyr)
STEP 2: Library confirmation
Library confirmation
library(ggplot2)
library(tidyr)
library(dplyr)
STEP 3: Data arrangement
Arrange your data according to the data below for the bar plot in R as arranged below.
Create the dataset
data2 <- data.frame(
Phylum = c(“Firmicutes”, “Bacteroidota”, “Verrucomicrobiota”, “Actinobacteriota”, “Patescibacteria”, “Cyanobacteria”),
CK = c(0.554451243, 0.182206958, 0.043143373, 0.007392163, 0.003113335, 0.015268673),
HF = c(0.396511759, 0.293976317, 0.031805244, 0.004373323, 0.003136205, 0.018431486),
LD = c(0.476340519, 0.378172571, 0.068991504, 0.00395076, 0.05411316, 0.001326105),
MD = c(0.520954804, 0.41071675, 0.238407588, 0.001095394, 0.020159134, 0.014428713),
HD = c(0.616607417, 0.263519982, 0.300676292, 0.007785212, 0.065658134, 0.003285882)
)
STEP 4: Reshaping data
Reshaping data format according to your parameters and demand by following the below format to get your bar plot in R.
Reshape the data to long format
data_long <- data2 %>%
pivot_longer(cols = -Phylum, names_to = “Time”, values_to = “Abundance”)
STEP 5: Color scheme
Color customization for R bar plots needs color variations among different parameters and represented data. You should consult the color codes online (imagecolorpicker.com) for the color scheme.
Custom color palette
custom_colors <- c(“Firmicutes” = “#1f78b4”,
“Bacteroidota” = “#33a02c”,
“Verrucomicrobiota” = “#e31a1c”,
“Actinobacteriota” = “#ff7f00”,
“Patescibacteria” = “#6a3d9a”,
“Cyanobacteria” = “#b15928”)
STEP 6: Plotting codes
The final code for R is to plot the bar chart below as per the given data format.
Plot the data
ggplot(data_long, aes(x = Time, y = Abundance, fill = Phylum))
geom_bar(stat = “identity”, position = “fill”, width = 0.5) # Use fill to stack the bars
scale_y_continuous(limits = c(0, 1)) # Y-axis scale from 0 to 1
scale_fill_manual(values = custom_colors) # Apply custom colors
theme_minimal()
theme(
axis.text.x = element_text(angle = 45, hjust = 1),
panel.grid = element_blank(), # Remove grid lines
axis.line = element_line(color = “black”), # Show x and y axis lines
axis.ticks.length = unit(-0.1, “cm”), # Tick marks inside
axis.ticks = element_line(color = “black”) # Remove grid lines
)
labs(title = “”,
x = “Time”,
y = “Relative Abundance (%)”)
Graphical result

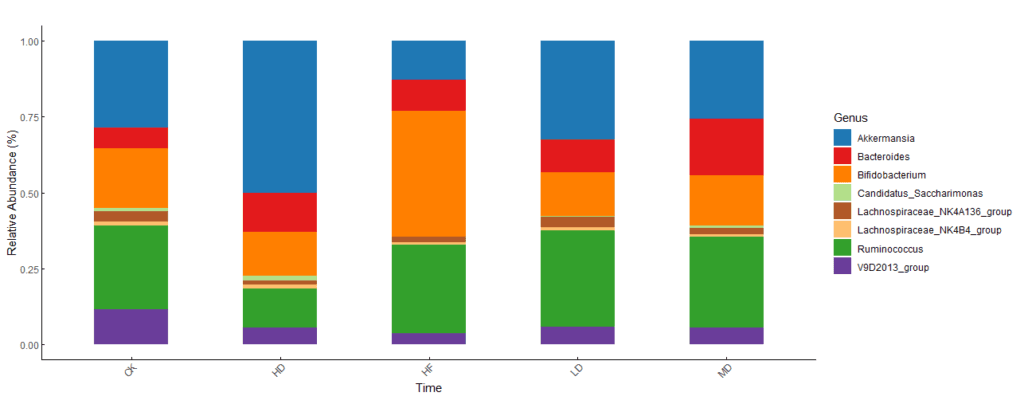
If you have other data with different parameters, like genus
data2 <- data.frame(
Genus = c(“Akkermansia”, “Ruminococcus”, “Bacteroides”, “Bifidobacterium”, “V9D2013_group”, “Lachnospiraceae_NK4A136_group”, “Candidatus_Saccharimonas”, “Lachnospiraceae_NK4B4_group”),
CK = c(0.28035994, 0.393842562, 0.091509169, 0.080646313, 0.092374166, 0.050644339, 0.001986135, 0.008637377),
HF = c(0.204482188, 0.265273261, 0.090768021, 0.053860298, 0.11089854, 0.040356695, 0.002986629, 0.011818974),
LD = c(0.38459033, 0.312770353, 0.148048753, 0.152804016, 0.115067945, 0.04615783, 0.002795483, 0.017873432),
MD = c(0.424037583, 0.196439269, 0.076367845, 0.209200202, 0.062740285, 0.034065992, 0.022096073, 0.014500003),
HD = c(0.407250885, 0.125519309, 0.096402186, 0.225794568, 0.067858093, 0.03385486, 0.030421792, 0.012898308)
)
Reshape the data to long format
data_long <- data %>%
pivot_longer(cols = -Genus, names_to = “Time”, values_to = “Abundance”)Custom color palette
custom_colors <- c(“Akkermansia” = “#1f78b4”,
“Ruminococcus” = “#33a02c”,
“Bacteroides” = “#e31a1c”,
“Bifidobacterium” = “#ff7f00”,
“V9D2013_group” = “#6a3d9a”,
“Lachnospiraceae_NK4A136_group” = “#b15928”,
“Candidatus_Saccharimonas” = “#b2df8a”,
“Lachnospiraceae_NK4B4_group” = “#fdbf6f”)Plot the data
ggplot(data_long, aes(x = Time, y = Abundance, fill = Genus))
geom_bar(stat = “identity”, position = “fill”, width = 0.5) # Use fill to stack the bars
scale_y_continuous(limits = c(0, 1)) # Y-axis scale from 0 to 1
scale_fill_manual(values = custom_colors) # Apply custom colors
theme_minimal()
theme(
axis.text.x = element_text(angle = 45, hjust = 1),
panel.grid = element_blank(), # Remove grid lines
axis.line = element_line(color = “black”), # Show x and y axis lines
axis.ticks.length = unit(-0.1, “cm”), # Tick marks inside
axis.ticks = element_line(color = “black”) # Remove grid lines
)
labs(title = “”,
x = “Time”,
y = “Relative Abundance (%)”)

Reference
Researchers Lens
R software


